
2024 Market Update
2023 Recap:
We started 2023 with many market participants very worried about a large or deep recession, and the negative impacts that would have. Our economy proved to be resilient in 2023 and the recession that was widely telegraphed never came. Inflation fell from 6.1% to 3.4% for the year. The lower inflation data we saw at the end of October and November started to turn the tide with the expectation that the Fed was done raising rates. Then, surprisingly the Fed announced the welcome news of a pivot in December, ahead of expectations, signaling three potential rate cuts in 2024. That news pushed both bond and stock markets higher into year end and we would expect it to continue into 2024.
Before we continue, let’s take a final look at 2023 by the numbers.

*Performance reflects index values as of market close on December 29, 2023.
All indices including the bond market rose last year. The Dow Jones Industrial Average notched seven record highs throughout 2023. The S&P 500 closed the year less than 1% from all-time highs, and the Tech Heavy Nasdaq saw its best year since the 1999 tech bubble rebounding 43.4%. As great as it was for the Nasdaq last year, keep in mind in 2022 it fell 33%, meaning some of the stocks in the index were down well over 50-60%.
Small-cap companies, which had been a significant underperformer for the year, showed signs of a resurgence as it was the best performer in the fourth quarter. International markets started to improve as the global economy continued to rebound from Covid and supply chain stricken gridlocks.
Still, it may be too soon to celebrate the Fed engineering a “soft landing” – a return to the target inflation rate without a recession. For one, inflation remains above their 2.0% target. Two, the lagging effects of its rate hike program continue to cool economic activity. And three, the repercussions of higher economic growth or any other geopolitical event with the potential to disrupt food and energy prices could directly influence inflation and change future Fed policy.
The market returns explained above are not all that it may seem. While the markets show signs things have started to rebound, 72% of the stocks in the S&P 500 are still undervalued. We have not had a full market rally and may not until after the Fed has started to reduce rates.
Magnificent 7:
During 2023, we did not see a broad rally, in fact, it was very narrow.
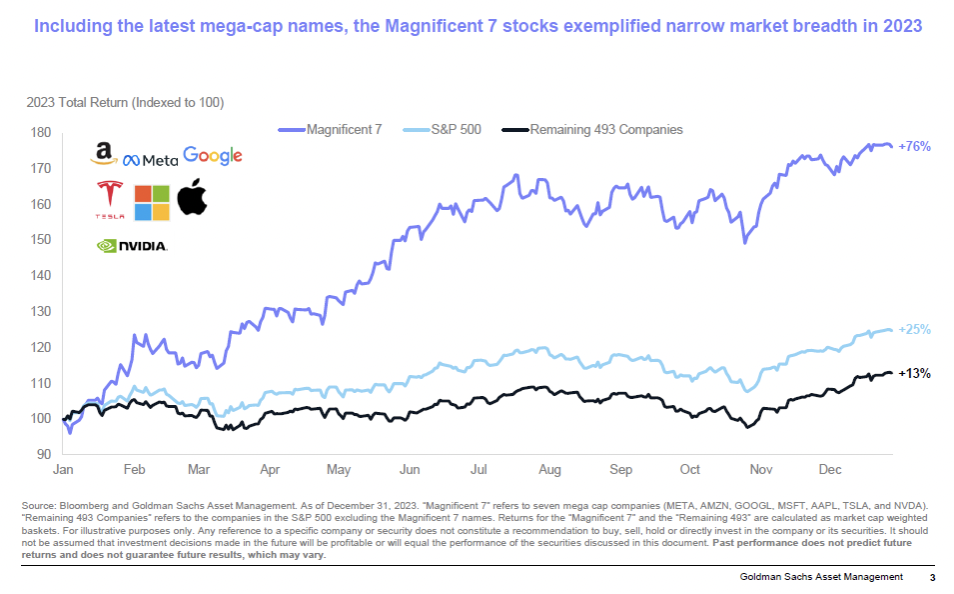
As you can see from the chart above, as exciting as it was to watch the S&P rise 25% last year, of the 500 stocks in the index, 7 have dominated the returns, accounting for about two-thirds of the gains in the S&P 500 last year. Nvidia lead the group with a gain of about 239%.
These 7 companies make up 35% of the S&P 500 market share and have been coined the “Magnificent 7”. In other words, for every $100 invested in the S&P 500, $35 is invested in just 7 companies.
These 7 companies (Amazon, Google, Meta, Microsoft, Tesla, Nvidia & Apple). grew by 76% last year. If you were to remove these 7 out of the S&P 500 indicated by the black line, the index would have grown by 13% not 25%, a 12% difference.
This means there are still buying opportunities regardless of the status of the index. The average stock, by comparison, has been in a two-year bear market. The recent activity suggests positive movement below the surface, meaning 2024 could bring more opportunity for those stocks left behind. December saw 10 of the 11 sectors finish in the green, with interest-rate sensitive sectors leading the way.
Diversification:
Today’s increased risk appetite exists with a historically, narrow market. Investors are rejecting the benefits of diversification and taking more concentrated positions in riskier positions.
Narrow leadership historically signals risk within the equity markets. Healthy bull markets are typically characterized by broad leadership because a healthy economy benefits many companies. The magnificent seven leadership, therefore, implies an unusually dire economic forecast. A healthier than expected economy normally argues for broader market leadership, so the magnificent seven extreme performance suggests their rally has been fueled more by speculation than by fundamentals.
We often refer to the chart below as the jelly bean chart. Each asset class of the market is color coordinated to demonstrate not every one performs the same each year. In order to help reduce volatility and market risk, we recommend staying properly diversified. Diversification doesn’t protect from losses, it helps reduce volatility. The smoother the ride, the easier it is to stay invested and not allow our emotions distract us from our financial goals.

There are many times investors exit the market as they can’t handle the swings in their portfolios. Too often it’s because they are not properly diversified and have too much invested in riskier asset classes. The white blocks represent a 70/30 diversified portfolio, 70% equity and 30% bonds. Notice how the path is a lot smoother, diversification helps minimize losses and makes it easier to stay the course. The worst asset class in 2022 was Real Estate falling 24%, while the best performer was commodities. Cash came in 2nd, earning a whopping 1.5%. Notice that over the past 16 years, cash has only been the top performer one time. And of course, the problem with cash in 2022 was peak inflation at 9.1% - there was no place to hide in 2022! In fact, you may notice that last year’s winner is often this year’s loser.
Volatility:
We have shared this chart regularly, which shows a number of historically accurate points for us to keep in mind.
First, while past returns are no guarantee for future returns, it’s important to understand that out of the past 44 years the equity markets were up 75% of the time - we have many more positive years than negative ones. Of course, that means we have down years 25% of the time. History is on your side that the markets should be up in value rather than down. But notice the red dots below - 100% of the time we will have dips, corrections or pull-backs during the year. The average dip over the last 44 years is 14.2%. Meaning, if we experienced a 14.2% dip sometime this year, while not fun, it would be normal and healthy.
Second, as noted earlier, this shows us that after every off year, with only one exception, when the S&P has declined, it has usually been followed by a couple of good years. The exception is in the middle of the chart. This was the early 2000’s and generally knows as the “Tech Wreck”, as well as the effects of 9/11 extending the recession and market declines.

Here is a similar chart showing the history of the Bond Market.

Over the last 48 years bonds have been positive nearly 90% of the time. Bonds are purchased not to experience equity like returns and accumulate wealth, but to generate income and reduce volatility.
Over the last 48 years we haven’t experienced a double-digit drop in bond valuations except in 2022. 2022 had the worst start to the bond market in 40 years. Like the equity chart, we experience intra year dips in the bond market as well, but the average over the last 48 years is 3.4%.
As we have discussed in the past, there is an inverse relationship between bond prices and interest rates. As this chart shows as interest rates rise, prices fall. If you owned a bond from XYZ Company paying you 3% in 2022, each time the Fed increased interest rates the demand for your bond paying 3% fell in value. With the Fed Funds rate near 5.25%, all bonds paying below that rate have seen price declines. Bond prices will not fully rebound until the Fed starts to reduce rates again. With the announcement from the Fed that they anticipate reducing rates 3 times this year, investing in bonds now may be one of the best times to do so in the past 48 years.

The chart below helps show anticipated returns in bonds if we see a 1% drop or rise in interest rates. A 1% drop in rates could produce a 10.8% return for the US Bond Agg. Investing in short term bonds with 2 year or under maturities could produce a 6% return.
The problem many Americans face today is with money market and CD accounts paying north of 5%. Once rates start being cut, your current yield will drop dramatically - and quickly. While we do not have a crystal ball and cannot forecast when the first rate cut will occur, your money may be better off in short term bonds or bonds in general to participate in the estimated rebound that will occur once rates start coming down while collecting decent yields.
One of our jobs has been to find ways for us to lock in these good, high rates for longer. We have been taking advantage of longer maturity treasury bills, Structured Notes, Fixed and Equity Indexed Annuities. Let us know if you have any extra “lazy money” at the bank that you want to put to work.
One major concern we have had for the past few months is the level of interest in high yielding CD’s and Money Market accounts. We are all for taking advantage of these rates right now. But our caution continues to be, these rates are not likely to last too long. Remember, we didn’t have 5%+ CD’s a year ago and likely won’t have those rates when your current CDs mature. Contact us for the best available rates that we have when you start to see rates decline.

Three 2024 Themes:
If 2023 was the year of speculation, 2024 might be the year of a return to fundamentals. The market environment looked a lot brighter at the tail end of 2023 than it did at the close of a dreary 2022.
Here are three themes that we are watching for 2024:
Fed rate cuts - as announced, we anticipate three cuts from the Fed. The market is expecting six. We’ll likely end up somewhere in the middle.
Rebound continuing - As noted earlier, we remain cautiously optimistic for 2024 as history has shown that following an off-year (2022), we typically see the next two or three years being positive.
Election year - while we expect an increase in volatility because of it being an election year, especially as we dive deeper into the election process, history has shown that the markets often rally after the election, regardless of which party is in power. This is because the uncertainty of the election has been removed.
From this chart, we can see what happens after the Fed stops hiking rates. Looking at the last 6 occurrences when the Fed ended rate hike cycles the S&P 500 on the left rose in all occurrences except 1999-2000 when we had the Tech bubble. When looking at the Bond market on the right every year after the Fed ended rate hikes, the bond markets rebounded. Past results are no guarantee for future results, but when rates fall, bond prices rise.

Keep in mind, the media will try to make it sound like the Fed is cutting rates due to an “impending economic collapse”. They have been on a mission for nearly two years to “slow” the economy, but not try to “crash” it. This is the debate - soft landing, hard landing, mild or deep recession.

Any rate cuts by the Fed are likely to be more cautious than usual. It may not happen for some time. The first rate cut is not expected until the Fed meetings in May or June, depending on the data we receive. Rate decreases throughout 2024 should be more modest with a fed funds target rate, dropping to the 4 to 4.2% range by year end. This cautious approach to rate easing could extend into 2025 and beyond, especially if a potential recession is as mild as expected.
The following charts shows some areas of concern related to the growth in the economy. Currently, the leading economic indicators have been flashing recession warnings for some time, so 2024 might be the year when these readings are inevitably proven correct.
Restrictive monetary policy from the Fed is likely to lead to enough spending reductions by consumers and businesses to drive a slowdown. But the projected slowdown should be relatively short and mild, bouncing back after that.
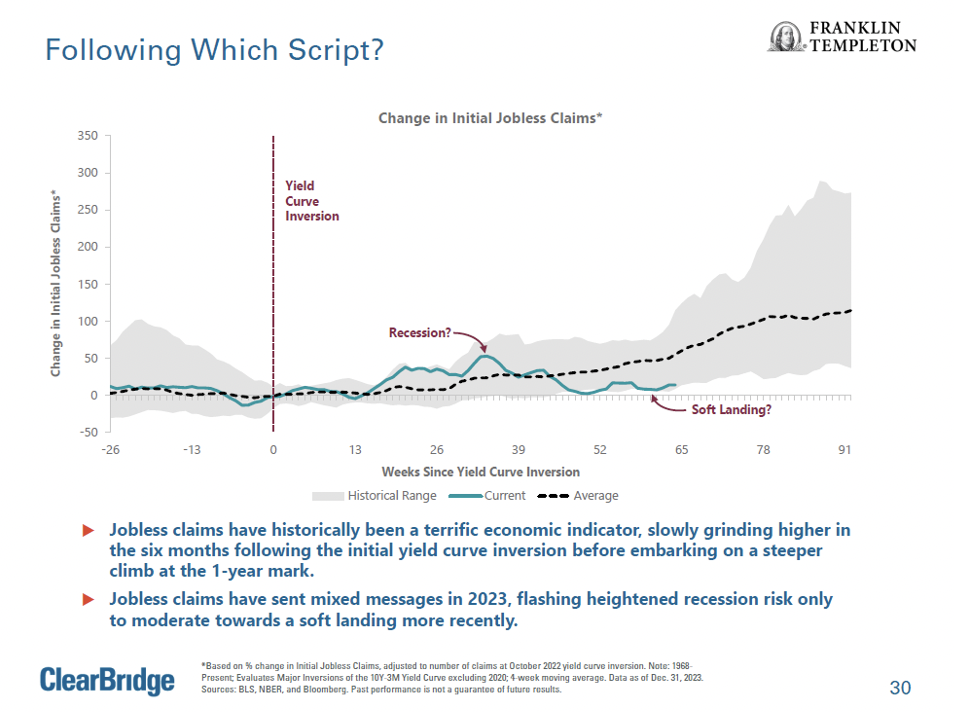
Additionally, many people have asked about the “inverted yield” curve. This has oftentimes foreshadowed a future recession.
We would also like to remind everyone that all recessions are not made equal! The next recession we experience is likely to be much different than say, the 2007-2009 recession that we experienced.
The probability of the US weakening into a recession is still on the table. Employment is expected to slow sharply in the coming months as businesses look to cut expenses with profit margins squeezed by high interest rates and waning price increases.
We may even see modest job losses by mid-year. Correspondingly consumer spending may struggle as lower incomes and job concerns weigh on activity. In addition, inflation concerns are likely to linger throughout 2024, as rising costs for services and housing maintain an above trend pace of price growth. The good news is rent increases are starting to come down as that part of the real estate market has been saturated with new builds and vacancies rise.
Headline inflation readings should continue to slowly fade throughout this year, with year-on-year readings for the consumer price index. CPI dipping below 3% by the end of 2024. CPI inflation is expected to return to trend of around 2% to 2.5% in 2025.
The Fed is purposely slowing economic growth to combat inflation. While we have succeeded in inflation falling, it is still not where it needs to be to convince the Fed inflation has been fixed. Higher rates for longer will continue to hurt economic growth and may lead to an increase in layoffs. We are starting to hear from a few companies of layoffs as earnings may be tougher to obtain due to our economy slowing. A soft landing or a mild recession, could still happen this year, just with a historically stronger labor market.

We are back to pre-Covid levels on the % of 25–54-year-olds in the workforce but have not recovered from those 55 and older. Many will not return and therefore we may have a new norm when it comes to unemployment. Jobs that may never be filled and will have to re-adjust our expectations going forward. Artificial Intelligence is one possibility that may fill some of these job vacancies. With more workers out of the workforce our economy may not continue to be resilient which is why a recession warning is on the table.
The prospect that AI will change the economy is shaping investor’s opinion today. The Internet did indeed change the economy - technology, stocks, high valuations, and unrealistic profit forecast resulted in below normal, and the so-called lost decade in equities. The difference today is the top leading AI companies have ample cash holdings, making profits as they have tangible products to sell.
JPMorgan Analysts expectations show earnings growing by 11% this year, double the long-term average. Dissecting the sources of earnings growth, margins could maintain stability, but revenues are likely to slow.
On margins, pricing power is waning, but input costs and wages are decelerating. Interest costs remain high, but 49% of S&P 500 debt is fixed beyond 2030, with no more than 7% maturing in any calendar year until then. Many S&P 500 companies also maintain ample cash balances, which are earning meaningful interest. Therefore, interest costs as a share of profits are falling.
Slower Growth Prospects:
However, disinflation, slowing economic growth and headwinds to the consumer are likely to constrain revenues. If the U.S. economy goes into recession, profit growth would likely contract, weighing on stocks. We don’t expect a massive imminent correction while profits are still growing, but valuations may need to reset over time in a higher-for-longer rate environment.

As we continue to monitor the economy and markets, we also will be distracted by the political noise all around us. It is imperative to stay the course and not let your personal political views change the way you invest. The markets don’t care what our politics are.

Looking back since 1947, good things happen no matter which party is in charge. What we want as investors isn’t really what we want as Americans. Gridlock! Having a divided government keeps the status quo and makes it hard for new or extreme policies to be created. The market doesn’t like uncertainty, therefore when it arises, the markets become volatile and hard to stay focused. Once the outlook becomes clear, the markets calm down. 61% of the time since 1947 we’ve had a divided government, and the S&P averaged 7.9%. Under Democrat control, we have averaged 9.9% returns and when Republicans controlled government, we have averaged 12.9%. On the other hand, economically when Democrats have full control, our economy has average 4% GDP compared to 2.8% when Republicans have full control or 2.7% GDP with a divided government.
For those that hated Obama and sat on the side lines, you missed an average 16.3% rate of return during his term. For those that hated Trump, you also missed out on a 16% rate of return on average during his term. It’s ok to not be happy with the candidates, remember why you are invested, and focus on the returns needed to help you achieve your financial goals.
Call to Action:
So, what now? With all of this information and data, it’s easy to get paralysis by analysis. Our job for you, our clients, is to help grow or maintain your net worth. The two things that your Sterling Fox Financial Services team are focused on are:
Your goals - when do you need the funds to help with retirement, that dream vacation, helping a child gain an education, weddings or that new car you have always wanted. Let’s match your investments with your goals and timeframes.
Your risk tolerance - how comfortable are you with the inevitable volatility that we see each and every year? We found that people feel like they can take on more risk when the markets are higher, only to find out that they can’t handle swings that are common with higher levels of risk.
If needed, let’s review where you are today, both in terms of your goals and risk level.
With slower, economic growth, narrowing, profit, margins, weakness, and a job market and consumer spending ahead, the soft-landing debate is likely to persist throughout 2024.
As the potential for market volatility remains high, investors should view any sell off event as an opportunity to build a portfolio consistent with your goals, time horizion and risk tolerance.
We ended 2023 on a high note, after months of data dependent factors that left investors puzzled. We will continue to watch and monitor the new data forthcoming to see what adjustments and changes may be needed to help navigate through these issues.
If or when you get too stressed out, remember our old admonition to not check your balances too often and for heaven’s sake, turn off the news.
As always, we appreciate your trust and confidence in our team at Sterling Fox Financial Services. Please let us know if you have any questions about this market update or anything specific to your investments and plans.
We hope your spring and summer plans are gearing up after the long winter months.


